Chemistry
Help Questions
ACT Science › Chemistry
A student performed the following procedures to study various photosynthetic pigments (light-absorbing chemicals) in tree leaves and the wavelengths of light they absorb.
Experiment 1:
The student obtained samples of leaves from oaks, maples, ashes, sycamores, and poplars. Each leaf sample was ground separately with a mortar and pestle to release the pigments, and then each sample was suspended in water to make a colored solution of the pigment. The student then measured the absorption spectrum (a graph of how much light is absorbed by a pigment at varying wavelengths of light) of each solution in a device called a spectrophotometer. The setup of a spectrophotometer is shown below in Diagram 1.
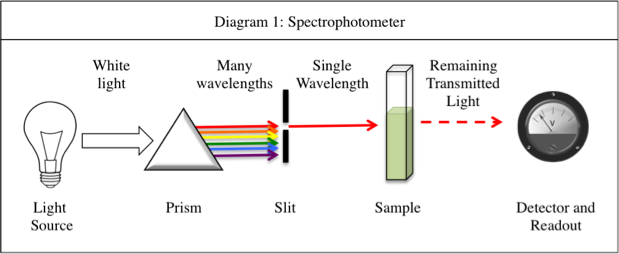
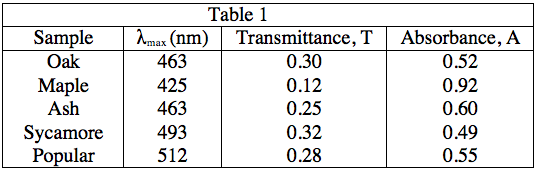
The light source emits white light, which is split into its various wavelengths by the prism. Next, a slit, which can be moved up or down to select a particular wavelength, is used to transmit just a single wavelength to the sample. The sample absorbs a fraction of this light that is characteristic to the pigment in the sample, and the rest is transmitted to the detector for a readout. Using the spectrophotometer, the student found the λmax (the wavelength of light in nanometers (nm) that the pigment absorbs most intensely, for each sample) and recorded the results in Table 1. Table 1 also shows the transmittance and absorbance values at λmax. Transmittance, T, is defined as the fraction of light, expressed as a decimal, which passes through the sample. Absorbance, A, is given by:
A = –log(T) or 10–A = T
Experiment 2:
A student is given a leaf from an unknown source. She crushes and extracts the pigment according to the procedure in Experiment 1. Measuring the absorbance spectrum in the spectrophotometer produces the following readout, shown in Diagram 2.
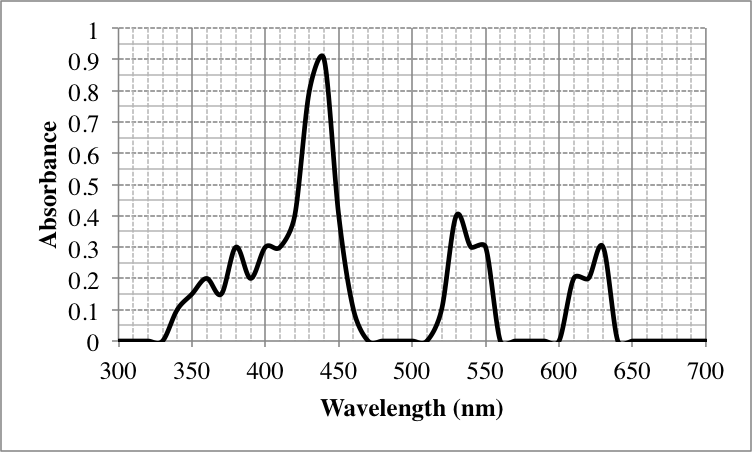
Diagram 2
A standardized sample of a pigment often found in plant leaves, called Chlorophyll A, was placed into the spectrophotometer and found to have a λmaxof 425 nm. The leaves of which tree most likely have a high concentration of Chlorophyll A?
Maple
Oak
Sycamore
Popular
Explanation
Table 1 shows that maple leaves have a λmaxat 425 nm. Thus, we can assume that this is most likely caused by the presence of Chlorophyll A as it has the same λmax, and the value of λmax is characteristic of a particular pigment.
A student performed the following procedures to study various photosynthetic pigments (light-absorbing chemicals) in tree leaves and the wavelengths of light they absorb.
Experiment 1:
The student obtained samples of leaves from oaks, maples, ashes, sycamores, and poplars. Each leaf sample was ground separately with a mortar and pestle to release the pigments, and then each sample was suspended in water to make a colored solution of the pigment. The student then measured the absorption spectrum (a graph of how much light is absorbed by a pigment at varying wavelengths of light) of each solution in a device called a spectrophotometer. The setup of a spectrophotometer is shown below in Diagram 1.
The light source emits white light, which is split into its various wavelengths by the prism. Next, a slit, which can be moved up or down to select a particular wavelength, is used to transmit just a single wavelength to the sample. The sample absorbs a fraction of this light that is characteristic to the pigment in the sample, and the rest is transmitted to the detector for a readout. Using the spectrophotometer, the student found the λmax (the wavelength of light in nanometers (nm) that the pigment absorbs most intensely, for each sample) and recorded the results in Table 1. Table 1 also shows the transmittance and absorbance values at λmax. Transmittance, T, is defined as the fraction of light, expressed as a decimal, which passes through the sample. Absorbance, A, is given by:
A = –log(T) or 10–A = T
Experiment 2:
A student is given a leaf from an unknown source. She crushes and extracts the pigment according to the procedure in Experiment 1. Measuring the absorbance spectrum in the spectrophotometer produces the following readout, shown in Diagram 2.
Diagram 2
In Experiment 2, at which of the following wavelengths, in nanometers, is the most amount of light transmitted through the sample?
500
400
450
350
Explanation
As the equations in the description of Experiment 1, as well as the patterns in the data in Table 1 indicate, a low absorbance provides a high transmittance and vice-versa. Thus, to find what wavelength gives the highest value of transmittance, we must look for the lowest absorbance value. As 500 nm gives an absorbance of 0, it will give a transmittance of 100%, the highest possible value.
A = 0, 10–0 = T = 1, or 100%
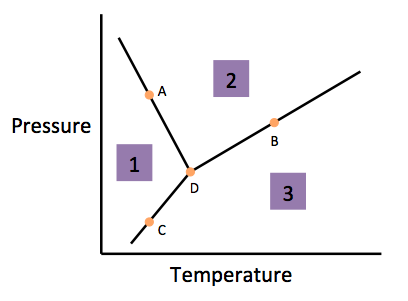
Chemists can model how solids, liquids, and gases behave at different temperatures and pressures with a graph called a phase diagram. When the pressure and temperature are simultaneously known, a scientist can predict whether the material will be in a specific state. The diagram is divided into sections depending on the phase and the lines between sections represent phase transitions occurring between two or more separate phases.
In general, solids of neatly stacked molecules exist when temperatures are low and pressures are intermediate. These values decrease the kinetic energy of the molecules enough to allow for attractive forces to begin the stacking process. Liquids, by contrast, are found at intermediate pressures and temperatures. The temperature is high enough to impart enough kinetic energy to prevent solid formation and the pressure is high enough to prevent the liquid from becoming a gas. Finally, a gas forms at low pressures and high temperatures. The high level of kinetic energy prevents molecules from associating with one another.
Materials can undergo processes called phase transitions, meaning they can transition from one phase to another. The transition from a solid to a liquid is called melting, while the reverse transition is called freezing. Vaporization occurs when a liquid becomes a gas, while condensation occurs when a gas becomes a liquid. Finally, in a process called sublimation, a solid can directly become a gas without passing through a liquid phase. Additionally, when a gas directly becomes a solid, this is known as deposition.
What property most likely allows for molecules to stack neatly when freezing?
Reduction in Kinetic Energy
Increase in Potential Energy
Symmetric Molecules
Repulsive Forces
Explanation
The beginning of paragraph two helps guide our thinking for this question. We know that molecules stack nearly when temperatures are low and pressures are intermediate. Decreasing kinetic energy allows the molecules to remain closer together and for the attractive forces that are present to initiate the stacking process. Thus, the beginning of the stacking process depends on the reduction in kinetic energy.
A brilliant but underpaid high school chemistry teacher, together with his former student, manufactures a chemical compound, which they sell for a large mark-up. Their set of reactions are given below:
(1) A + B + C + acid --> D
(2) D --> intermediate
(3) Intermediate --> E
(4) E + acid --> X
His student notes the following observations:
Observation 1) If a greater amount of B and C are used in the reaction, this yields no increased amount of product D.
Observation 2) At any given point, D, the intermediate, and E may co-exist in equal proportions. However, at higher temperatures, higher proportions of product E are noted.
Observation 3) The addition of a strong base can reverse reaction 4.
Without the addition of acid, reactions 1 and 4 proceed at a much slower rate. What is the role of acid in these reactions?
A catalyst; the acid lowers the activation energy of these reactions and helps them proceed more quickly.
A reagent (or substrate); the acid is needed as reagent for completion of these reactions.
An additive; the acid shifts the equilbrium constants of these reactions to produce more product.
No role in these reactions.
Explanation
The acid can be thought of as a catalyst. The question states that these reactions can proceed without acid, but at a much slower rate; therefore, acid is not needed for these reactions and is not a reagent or substrate; however, its presence will speed the rate of the reactions. Catalysts do not alter the equilibirum constant of a reaction. In other words, they will change the speed or rate of which product is produced, but once the reaction has carried out to completion and each agent is in equilibirum, there will not be relatively more product present because of the acid.
The Millikin oil drop experiment is among the most important experiments in the history of science. It was used to determine one of the fundamental constants of the universe, the charge on the electron. For his work, Robert Millikin won the Nobel Prize in Physics in 1923.
Millikin used an experimental setup as follows in Figure 1. He opened a chamber of oil into an adjacent uniform electric field. The oil droplets sank into the electric field once the trap door opened, but were then immediately suspended by the forces of electricity present in the field.
Figure 1:
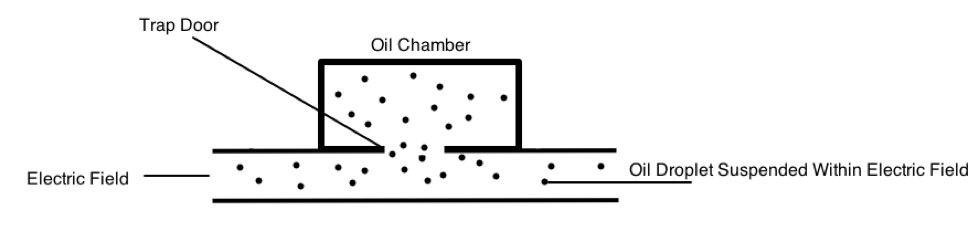
By determining how much force was needed to exactly counteract the gravity pulling the oil droplet down, Millikin was able to determine the force of electricity. This is depicted in Figure 2.
Using this information, he was able to calculate the exact charge on an electron. By changing some conditions, such as creating a vacuum in the apparatus, the experiment can be modified.
Figure 2:
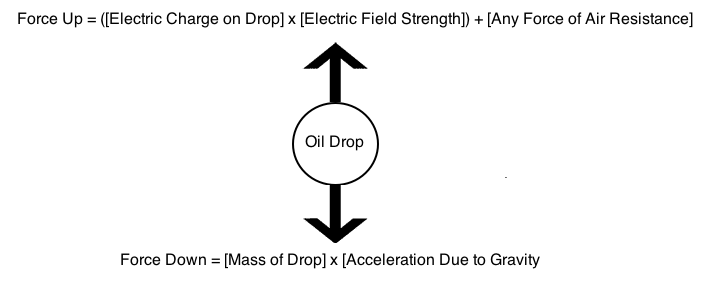
When the drop is suspended perfectly, the total forces up equal the total forces down. Because Millikin knew the electric field in the apparatus, the force of air resistance, the mass of the drop, and the acceleration due to gravity, he was able to solve the following equation:

 + [Air\hspace{1mm}Resistance] = [Mass] x [Acceleration\hspace{1mm}from\hspace{1mm}Gravity]")
 - [Air Resistance]}{Electric\hspace{1mm}Field}")
Table 1 summarizes the electric charge found on oil drops in suspension. Millikin correctly concluded that the calculated charges must all be multiples of the fundamental charge of the electron. A hypothetical oil drop contains some net charge due to lost electrons, and this net charge cannot be smaller than the charge on a single electron.
Table 1:
| Trial # | Electric Charge Calculated in Coulombs (C) | Vacuum Used? |
|---|---|---|
| 1 | 1.602176487 x 10⁻⁸ | No |
| 2 | 1.602176487 x 10⁻² | Yes |
| 3 | 1.602176487 x 10⁻⁶ | No |
| 4 | 1.602176487 x 10⁻⁴ | Yes |
The decision to use oil drops in Millikin's experiment was made after water drops were found to evaporate too quickly.
Another scientist conducts an experiment and places two beakers into sealed chambers within a single larger, constant pressure chamber, as in the figure below. The pressure and temperature conditions in the chambers are all very similar to the conditions used in the Millikin experiment from the passage, without a vacuum.
One beaker contains oil, and one beaker contains water. The volumes of both beakers are identical. Based on the information in the original passage, which of the following is most likely true:

There will be a greater amount of water vapor at point 2 than oil vapor at point 1.
There will be a smaller amount of water vapor at point 2 than oil vapor at point 1.
There will be about equal amounts of water vapor at point 2 as oil vapor at point 1.
We cannot predict which point will have a greater amount of vapor without knowing the absolute pressure in the chamber.
Explanation
The question specifies that water was found to evaporate too quickly. This suggests that water will evaporate more quickly in the similar conditions established in the question. Water vapor will, therefore, likely be more abundant than oil vapor above their respective beakers.
Chemists can model how solids, liquids, and gases behave at different temperatures and pressures with a graph called a phase diagram. When the pressure and temperature are simultaneously known, a scientist can predict whether the material will be in a specific state. The diagram is divided into sections depending on the phase and the lines between sections represent phase transitions occurring between two or more separate phases.
In general, solids of neatly stacked molecules exist when temperatures are low and pressures are intermediate. These values decrease the kinetic energy of the molecules enough to allow for attractive forces to begin the stacking process. Liquids, by contrast, are found at intermediate pressures and temperatures. The temperature is high enough to impart enough kinetic energy to prevent solid formation and the pressure is high enough to prevent the liquid from becoming a gas. Finally, a gas forms at low pressures and high temperatures. The high level of kinetic energy prevents molecules from associating with one another.
Materials can undergo processes called phase transitions, meaning they can transition from one phase to another. The transition from a solid to a liquid is called melting, while the reverse transition is called freezing. Vaporization occurs when a liquid becomes a gas, while condensation occurs when a gas becomes a liquid. Finally, in a process called sublimation, a solid can directly become a gas without passing through a liquid phase. Additionally, when a gas directly becomes a solid, this is known as deposition.
At Point D, the material is most likley in what phase(s)?
Solid, Liquid, and Gas
Solid
Liquid
Gas
Explanation
The last sentence of the first paragraph gives us an indication of what Point D may represent. We are told that the lines between sections represents a phase transition occuring between those respective phases. At Point D, however, we see that all three phases intersect, implying that all phase transitions are occuring simulaneously at this point and thus all states of the material may be present.
Both gases and liquids are considered to be fluids that have individual molecules that move around with kinetic and potential energy. Kinetic energy, defined as the energy related to motion, takes three forms: translational energy that occurs as a molecule moves from position A to position B, rotational energy that occurs as a molecule spins around an imaginary axis at its center of mass, and vibrational energy that occurs as individual atoms in a molecular bond move towards and away from each other. Usually, molecules possess varying combinations of kinetic energy forms. In contrast, potential energy is defined as stored energy that could be released to become kinetic energy. The total energy of a molecule is fixed, meaning that a molecule has some combination of kinetic and potential energies.
Varying amount of kinetic and potential energies define how molecules in a fluid interact with each other. For example, when the kinetic energy of a molecule is high (greater than 1000J), it can no longer interact with neighboring molecules strongly enough to remain a liquid. However, if the potential energies are too high (greater than 1000 J), molecules cannot escape a liquid to become a gas. If the kinetic energy is high and the potential energy is low, molecules tend to become a gas and can be modeled by an equation known as the Ideal Gas Law:

Where P is the pressure of a gas, V is the volume, n is the number of moles of a gas, R is a constant, and T is temperature in degrees Kelvin.
The Ideal Gas Law perfectly applies to particles with no mass, no intermolecular interactions, and no true volume. However, real molecules do not adhere perfectly to the Ideal Gas Law.
At a constant volume, the relationship between pressure and temperature as presented in the passage may best be depicted as:
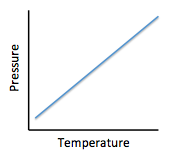
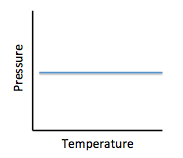
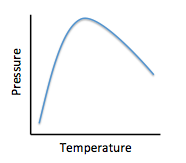
Explanation
Using the provided formula, we see that if volume is held constant, the relationship between pressure and temperature is a direct relationship. We know this because both are in the numerator on their respective sides of the equals sign. Thus, as pressure increases, we would also expect temperature to increase. A positive, straight line serves as the guide for this relationship.
The Ideal Gas Law is as follows:


A class of students began studying the Ideal Gas Law and how the Pressure and the Volume relate to one another. They took 20 moles of a sample gas and kept the room at a temperature of 300 Kelvin. They then used different sized containers of the gas to limit and expand the volume. At each different volume, they measure the pressure of the gas on its container. The table they made from their results is seen in table 1.
| Temperature in Kelvin | Pressure Measured in Pascals |
|---|---|
| 200 Kelvin | 16, 628 Pascals |
| 400 Kelvin | 33, 256 Pascals |
| 600 Kelvin | 49, 884 Pascals |
| 800 Kelvin | 66, 512 Pascals |
TABLE 1
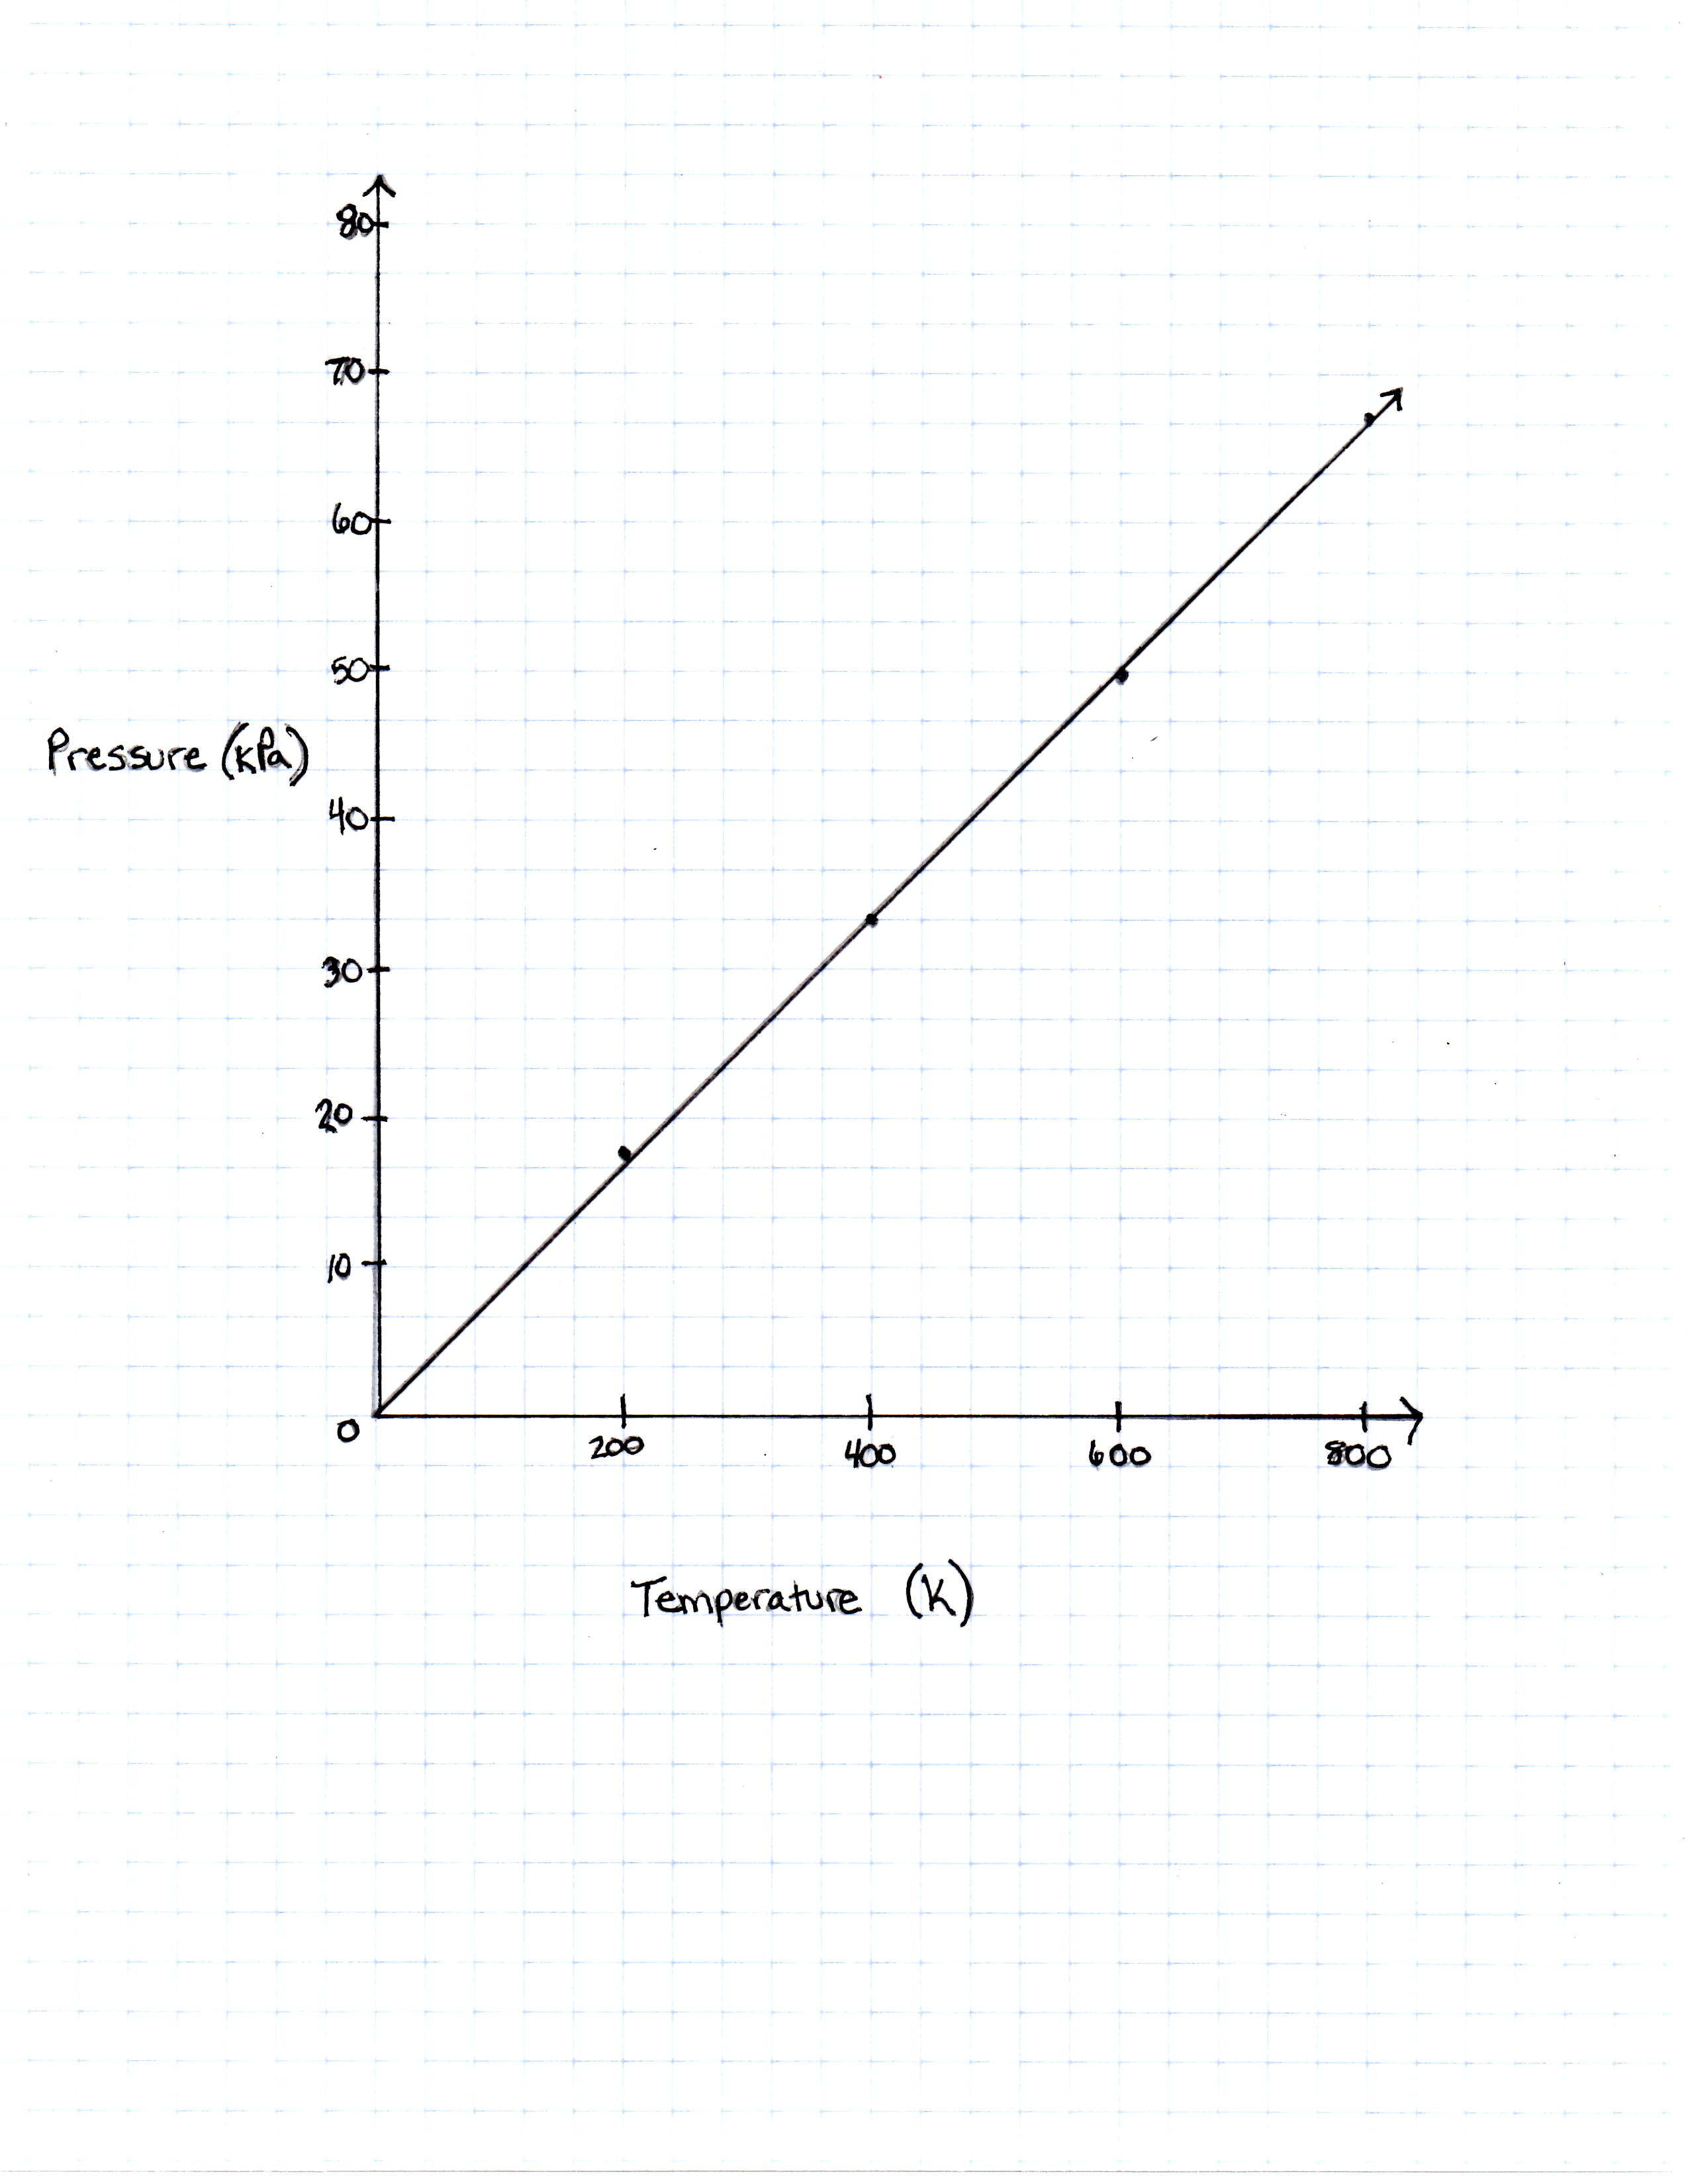
FIGURE 1
The graph the students made based on the data is seen in Figure 1.
Pressure is created by the movement of the gas molecules pushing against a container. 0 Kelvin is known as absolute 0, the temperature at which all molecule movement theoretically stops.
What would the pressure be if the temperature of the gas was increased to 273 Kelvin?


The answer cannot be determined from the equation

Explanation
The Ideal Gas Law is given with pressure measured in Pascals. If the number 273 Kelvin was plugged into the equation, the number of Pascals that would be 
(20)/2]273 = 22,697.22")
The rate of a reversible chemical reaction depends on many factors, including concentrations of the reactants and products, temperature, and presence of enzymes called catalysts. In the forward reaction, two reactants combine to form one product. However, in a reverse reaction, the product is broken down into the two reactants.
In order for a forward reaction to occur, the reactants moving around in the test tube must physically interact with each other. The more often reactants interact with each other, the more produce is formed in the same amount of time. The speed at which reactants combine into products (the rate of the reaction) can be calculated by dividing the amount of a chemical produced in a reaction (often measured in moles) by the time it takes to produce that amount.
In order to determine the effects of reactant and product concentration, temperature, and presence of catalysts on the rate of a reaction, a scientist studied the following reaction:

The scientist varied the conditions of the experiment and measured the rate of the reaction. The results are outlined in Table 1. The units of concentration are moles per liter.
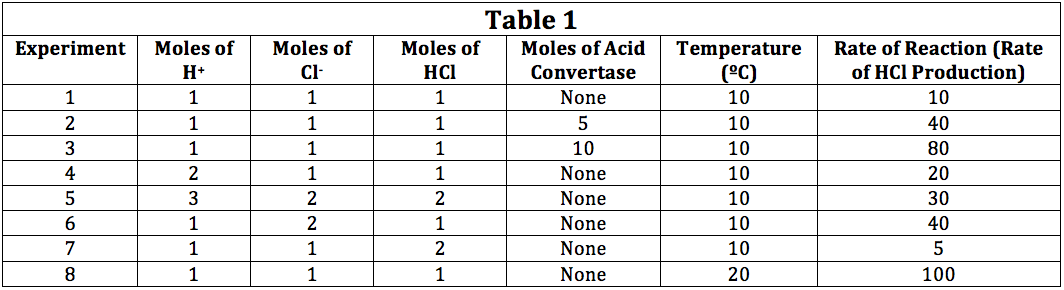
In order to display the relationship between the number of moles of H+ and the rate of the reaction in Experiments 1 and 4, the scientist could:
Plot the number of moles of H+ against the rate of the formation of HCl
Plot the number of moles of H+ against the moles of Cl-
Plot the number of moles of H+ against the temperature
Plot the number of moles of H+ against the moles of acid convertase
Explanation
The question asks us to determine the best way to show the relationship between the moles of a certain reactant, H+, and the rate of the reaction. The most logical way would be to plot the moles versus the rate, providing a line or bar graph that would show how the rate increased with increasing concentration of the reactant. The other plot set ups do not provide a clear way to show how increasing or decreasing the concentration of a reactant would change the rate.
Chemists can model how solids, liquids, and gases behave at different temperatures and pressures with a graph called a phase diagram. When the pressure and temperature are simultaneously known, a scientist can predict whether the material will be in a specific state. The diagram is divided into sections depending on the phase and the lines between sections represent phase transitions occurring between two or more separate phases.
In general, solids of neatly stacked molecules exist when temperatures are low and pressures are intermediate. These values decrease the kinetic energy of the molecules enough to allow for attractive forces to begin the stacking process. Liquids, by contrast, are found at intermediate pressures and temperatures. The temperature is high enough to impart enough kinetic energy to prevent solid formation and the pressure is high enough to prevent the liquid from becoming a gas. Finally, a gas forms at low pressures and high temperatures. The high level of kinetic energy prevents molecules from associating with one another.
Materials can undergo processes called phase transitions, meaning they can transition from one phase to another. The transition from a solid to a liquid is called melting, while the reverse transition is called freezing. Vaporization occurs when a liquid becomes a gas, while condensation occurs when a gas becomes a liquid. Finally, in a process called sublimation, a solid can directly become a gas without passing through a liquid phase. Additionally, when a gas directly becomes a solid, this is known as deposition.
At Point D, the material is most likley in what phase(s)?
Solid, Liquid, and Gas
Solid
Liquid
Gas
Explanation
The last sentence of the first paragraph gives us an indication of what Point D may represent. We are told that the lines between sections represents a phase transition occuring between those respective phases. At Point D, however, we see that all three phases intersect, implying that all phase transitions are occuring simulaneously at this point and thus all states of the material may be present.