How to graph functions of area - AP Calculus AB
Card 0 of 98
Find the area bounded by the curve  in the first quadrant.
Find the area bounded by the curve
The curve is in quadrant one over the interval  , which are the bounds of integration. To see this, note that the x-intercepts are 0 and 2 and the parabola opens downward.
The definite integral below is solved by taking the antiderivative of each term of the given polynomial function, evaluating this antiderivative at the bounds of integration, and subtracting the values.
For this particular integral use the rule,  to solve.
dx=(x^2-\frac{1}{3}x^3)|^2_0=(2^2-\frac{1}{3}\cdot2^3)-(0^2-\frac{1}{3}\cdot0^3)=\frac{4}{3}")
The curve is in quadrant one over the interval
The definite integral below is solved by taking the antiderivative of each term of the given polynomial function, evaluating this antiderivative at the bounds of integration, and subtracting the values.
For this particular integral use the rule,
Compare your answer with the correct one above
Find the area bounded by the curve  and the
  -axis over the interval
  .
.
Find the area bounded by the curve
The curve is in quadrant one over the given interval, which gives us the bounds of integration. Evaluating this definite integral yields the area we are after.
In order to performe the antiderivative, let  . It follows that
  . Therefore
dx= \int u du=\frac{1}{2}u^2 + C = \frac{1}{2} \sin^2 x + C")
so
dx= \left[ \frac {1}{2}\sin^2 x \right] ^\frac{\pi}{2}_0= \left( \frac{1}{2}\sin^2\frac{\pi}{2} \right) - \left( \frac{1}{2}\sin^2 0 \right)=\frac{1}{2}")
The curve is in quadrant one over the given interval, which gives us the bounds of integration. Evaluating this definite integral yields the area we are after.
In order to performe the antiderivative, let
so
Compare your answer with the correct one above
Find the area bounded by the curve  and the
  -axis over the interval
  .
.
Find the area bounded by the curve
The curve is positive over the given interval, so the endpoints of the interval will mark the bounds of integration. This function is very easy to integrate because the derivative of  is itself!

The curve is positive over the given interval, so the endpoints of the interval will mark the bounds of integration. This function is very easy to integrate because the derivative of
Compare your answer with the correct one above
Find the area bounded by the curve  and the
  -axis over the interval
  .
.
Find the area bounded by the curve
This function is positve over the given interval, so the endpoints of the interval mark the bounds of integration. It is a straightforward integration that is solvable with u-substitution. Let  so
so  . This means

so
-(-e^0)=-\frac{1}{e}+1=\frac{e-1}{e}")
This function is positve over the given interval, so the endpoints of the interval mark the bounds of integration. It is a straightforward integration that is solvable with u-substitution. Let
so
Compare your answer with the correct one above
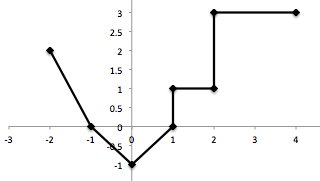
Graph of a piecewise-linear function  , for
, for  , is shown above.
Find
dx") .
.
Graph of a piecewise-linear function
Find
Find the area under the graph  from
from  . To do this break the graph up into triangles, squares, and rectangles to calculate the individual areas over smaller intervals and then add them all together.
The areas are added to be:
(2)+\frac{1}{2}(1)(-1)+\frac{1}{2}(1)(-1)+(1)(1)+(2)(3)\right]=7")
Therefore,
dx=7") .
.
Find the area under the graph
The areas are added to be:
Therefore,
Compare your answer with the correct one above
Find the area under the curve between the following bounderies of the following function.
=3x^2+7") in between the boundaries of
in between the boundaries of  and
and 
Find the area under the curve between the following bounderies of the following function.
We can find the area under the curve by taking the anti-derivative of the function and using the two boundaries as x values. The anti-derivative of =3x^2+7") is
is  . If we use the two boundaries, we end up with our answer,
 -(0^3+7(0)) = 160") .
.
We can find the area under the curve by taking the anti-derivative of the function and using the two boundaries as x values. The anti-derivative of
Compare your answer with the correct one above
Evalute the following Definite Integral:
Cos(x))dx")
Evalute the following Definite Integral:
For this integral one may be tempted to directly integrate; however, this is no rule of integrals which allows us to do so.
We must apply a complex method of integration, here u-subtitution works best.
We notice that Cos(x) is the derivative of Sin(x) so it may be best to let ,du=Cos(x)dx") .
.
Now that we have found a proper u and du, we may directly substiute into our original integral
du=\frac{u^2}{2}_{x=0}^{x=\pi}")
However, our limits are in terms of x so we must substitute our u=Sin(x) back in before evaluating
)^2}{2}_{x=0}^{x=\pi}=\frac{Sin(\pi)^2}{2}-\frac{Sin(0)^2}{2}=0-0=0")
For this integral one may be tempted to directly integrate; however, this is no rule of integrals which allows us to do so.
We must apply a complex method of integration, here u-subtitution works best.
We notice that Cos(x) is the derivative of Sin(x) so it may be best to let
Now that we have found a proper u and du, we may directly substiute into our original integral
However, our limits are in terms of x so we must substitute our u=Sin(x) back in before evaluating
Compare your answer with the correct one above
Find the area bounded by the curve in the first quadrant.
Find the area bounded by the curve
The curve is in quadrant one over the interval , which are the bounds of integration. To see this, note that the x-intercepts are 0 and 2 and the parabola opens downward.
The definite integral below is solved by taking the antiderivative of each term of the given polynomial function, evaluating this antiderivative at the bounds of integration, and subtracting the values.
For this particular integral use the rule, to solve.
The curve is in quadrant one over the interval
The definite integral below is solved by taking the antiderivative of each term of the given polynomial function, evaluating this antiderivative at the bounds of integration, and subtracting the values.
For this particular integral use the rule,
Compare your answer with the correct one above
Find the area bounded by the curve and the -axis over the interval .
Find the area bounded by the curve
The curve is in quadrant one over the given interval, which gives us the bounds of integration. Evaluating this definite integral yields the area we are after.
In order to performe the antiderivative, let . It follows that . Therefore
so
The curve is in quadrant one over the given interval, which gives us the bounds of integration. Evaluating this definite integral yields the area we are after.
In order to performe the antiderivative, let
so
Compare your answer with the correct one above
Find the area bounded by the curve and the -axis over the interval .
Find the area bounded by the curve
The curve is positive over the given interval, so the endpoints of the interval will mark the bounds of integration. This function is very easy to integrate because the derivative of is itself!
The curve is positive over the given interval, so the endpoints of the interval will mark the bounds of integration. This function is very easy to integrate because the derivative of
Compare your answer with the correct one above
Find the area bounded by the curve and the -axis over the interval .
Find the area bounded by the curve
This function is positve over the given interval, so the endpoints of the interval mark the bounds of integration. It is a straightforward integration that is solvable with u-substitution. Let so . This means
so
This function is positve over the given interval, so the endpoints of the interval mark the bounds of integration. It is a straightforward integration that is solvable with u-substitution. Let
so
Compare your answer with the correct one above
Graph of a piecewise-linear function , for , is shown above.
Find
.
Graph of a piecewise-linear function
Find
Find the area under the graph from . To do this break the graph up into triangles, squares, and rectangles to calculate the individual areas over smaller intervals and then add them all together.
The areas are added to be:
Therefore,
.
Find the area under the graph
The areas are added to be:
Therefore,
Compare your answer with the correct one above
Find the area under the curve between the following bounderies of the following function.
in between the boundaries of and
Find the area under the curve between the following bounderies of the following function.
We can find the area under the curve by taking the anti-derivative of the function and using the two boundaries as x values. The anti-derivative of is . If we use the two boundaries, we end up with our answer, .
We can find the area under the curve by taking the anti-derivative of the function and using the two boundaries as x values. The anti-derivative of
Compare your answer with the correct one above
Evalute the following Definite Integral:
Evalute the following Definite Integral:
For this integral one may be tempted to directly integrate; however, this is no rule of integrals which allows us to do so.
We must apply a complex method of integration, here u-subtitution works best.
We notice that Cos(x) is the derivative of Sin(x) so it may be best to let .
Now that we have found a proper u and du, we may directly substiute into our original integral
However, our limits are in terms of x so we must substitute our u=Sin(x) back in before evaluating
For this integral one may be tempted to directly integrate; however, this is no rule of integrals which allows us to do so.
We must apply a complex method of integration, here u-subtitution works best.
We notice that Cos(x) is the derivative of Sin(x) so it may be best to let
Now that we have found a proper u and du, we may directly substiute into our original integral
However, our limits are in terms of x so we must substitute our u=Sin(x) back in before evaluating
Compare your answer with the correct one above
Find the area bounded by the curve in the first quadrant.
Find the area bounded by the curve
The curve is in quadrant one over the interval , which are the bounds of integration. To see this, note that the x-intercepts are 0 and 2 and the parabola opens downward.
The definite integral below is solved by taking the antiderivative of each term of the given polynomial function, evaluating this antiderivative at the bounds of integration, and subtracting the values.
For this particular integral use the rule, to solve.
The curve is in quadrant one over the interval
The definite integral below is solved by taking the antiderivative of each term of the given polynomial function, evaluating this antiderivative at the bounds of integration, and subtracting the values.
For this particular integral use the rule,
Compare your answer with the correct one above
Find the area bounded by the curve and the -axis over the interval .
Find the area bounded by the curve
The curve is in quadrant one over the given interval, which gives us the bounds of integration. Evaluating this definite integral yields the area we are after.
In order to performe the antiderivative, let . It follows that . Therefore
so
The curve is in quadrant one over the given interval, which gives us the bounds of integration. Evaluating this definite integral yields the area we are after.
In order to performe the antiderivative, let
so
Compare your answer with the correct one above
Find the area bounded by the curve and the -axis over the interval .
Find the area bounded by the curve
The curve is positive over the given interval, so the endpoints of the interval will mark the bounds of integration. This function is very easy to integrate because the derivative of is itself!
The curve is positive over the given interval, so the endpoints of the interval will mark the bounds of integration. This function is very easy to integrate because the derivative of
Compare your answer with the correct one above
Find the area bounded by the curve and the -axis over the interval .
Find the area bounded by the curve
This function is positve over the given interval, so the endpoints of the interval mark the bounds of integration. It is a straightforward integration that is solvable with u-substitution. Let so . This means
so
This function is positve over the given interval, so the endpoints of the interval mark the bounds of integration. It is a straightforward integration that is solvable with u-substitution. Let
so
Compare your answer with the correct one above
Graph of a piecewise-linear function , for , is shown above.
Find
.
Graph of a piecewise-linear function
Find
Find the area under the graph from . To do this break the graph up into triangles, squares, and rectangles to calculate the individual areas over smaller intervals and then add them all together.
The areas are added to be:
Therefore,
.
Find the area under the graph
The areas are added to be:
Therefore,
Compare your answer with the correct one above
Find the area under the curve between the following bounderies of the following function.
in between the boundaries of and
Find the area under the curve between the following bounderies of the following function.
We can find the area under the curve by taking the anti-derivative of the function and using the two boundaries as x values. The anti-derivative of is . If we use the two boundaries, we end up with our answer, .
We can find the area under the curve by taking the anti-derivative of the function and using the two boundaries as x values. The anti-derivative of
Compare your answer with the correct one above