Create an account to track your scores
and create your own practice tests:
Test: GED Math
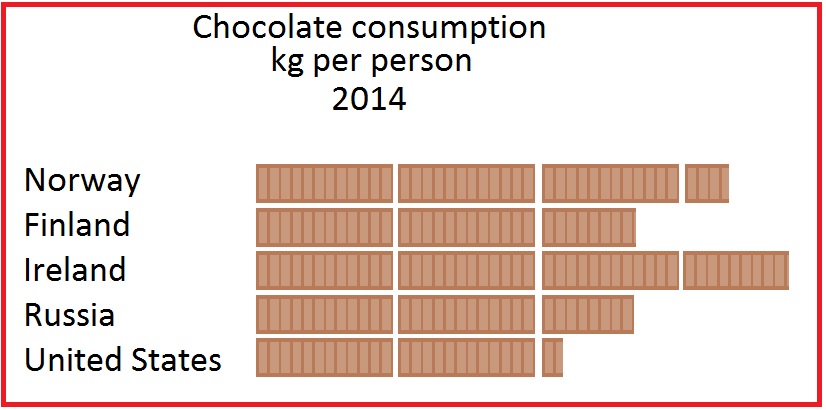
Source of figures: Euromonitor International via ConfectioneryNews.com
| 1. | The above pictograph represents the amount of chocolate eaten per person in 2014 in five countries. The legend is missing, but it is known that the average person in the United States ate 4.3 kilograms of chocolate in 2014. The average Austrian ate 7.8 kilograms of chocolate in 2014, according to the same source. How many chocolate bars would be used to represent Austria if it were added to this pictogram? |
Slightly more than three
Slightly less than four
Slightly less than three
Slightly more than four


Popular Subjects
Algebra Tutors in Los Angeles, French Tutors in Boston, Reading Tutors in Houston, Algebra Tutors in Miami, LSAT Tutors in Boston, Physics Tutors in Dallas Fort Worth, Biology Tutors in Atlanta, Physics Tutors in San Francisco-Bay Area, ACT Tutors in Washington DC, Biology Tutors in Dallas Fort Worth
Popular Courses & Classes
GMAT Courses & Classes in Phoenix, ISEE Courses & Classes in Denver, GRE Courses & Classes in Dallas Fort Worth, SSAT Courses & Classes in Seattle, SAT Courses & Classes in New York City, ACT Courses & Classes in Washington DC, GMAT Courses & Classes in San Diego, Spanish Courses & Classes in Los Angeles, Spanish Courses & Classes in San Diego, LSAT Courses & Classes in Boston

